
V8
dump is basically for memory managemnt, this is an important part of web app development. In the v8 dump
you can know about all the aspects of memory like number of object
instances, Shallow Size, Retained Size and distance.
In this article, we will learn how we can take a dump of the V8 heap and inspect that heap, and we will also
learn how to record heap snapshots with the Chrome DevTools heap profiler and find memory leaks.
Node.js is getting more popular and various types of apps are using Node.js as a back-end solution, thus we
need to ensure that our application doesn’t have a memory leak.
To ensure that our app doesn’t have a memory leak, we will take heap dumps. A heap dump can contain data
that can help in finding the memory leaks. So, to do this, we will integrate the npm module heap dump into
our app.
let's have a look about the terms related to v8 dump:
Constructor:
Constructor represents all objects created using this constructor
Shallow size:
The shallow size column in v8 displays the sum of shallow sizes of all objects - created by a certain constructor function. The shallow size is the size of memory held by an object itself (generally, arrays and strings have larger shallow sizes)
Retained size:
Retained size column displays the maximum retained size among the same set of objects. The size of memory that can be freed once an object is deleted (and this its dependents made no longer reachable) is called the retained size.
Number of object instances:
Number of object instances is displayed in the # column.
Distance:
Distance displays the distance to the root using the shortest simple path of nodes.

Create a Dump of the V8 Heap and Inspect It for Your Node App
For the demonstration, we will create a small Node application that has a file app.js and follows the steps below.
Let's create a dump of the V8 heap and inspect it for your node app:
Step 1. Create a Node App:
In this step, we'll create a folder, named "heapdump-demo", and add a file "app.js" into it.
app.js:
const heapdump = require('heapdump');
const express = require('express');
const app = express();
app.get('/', (req, res) => {
res.send(`You are at the best place to learn
`);
})
                        heapdump.writeSnapshot('/' + Date.now() + '.heapsnapshot');

                        heapdump.writeSnapshot(function (err, filename) {
                            console.log('dump written to', filename);
                        });
app.listen(8080, () => {
console.log(`go to http://localhost:8080/`)
});
Step 2. Install Dependencies:
Now, its time to install the related dependencies, So open your terminal and go to the file location. Install the dependencies by using the command below:
npm install express heapdumpo
Snapshot of ‘npm install express heapdump’
Step 3. Run the App
Run the app using the below command:
env NODE_HEAPDUMP_OPTIONS=nosignal node app.js
output of command "env NODE_HEAPDUMP_OPTIONS=nosignal node app.js"
Open the browser and hit the URL http://localhost:8080/. (Keep it open.)
Now, in the terminal, there is a message:
"dump written to heapdump-280936526.45328.heapsnapshot"You can also see this heap dump file in VS Code. (I am using VS Code.)
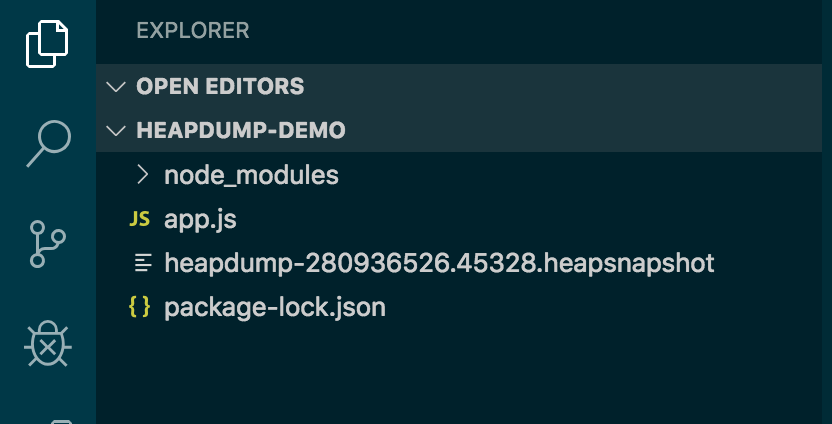
Snapshot of file “heapdump-280936526.45328.heapsnapshot”
Now, open your file heapdump-280936526.45328.heapsnapshot in VS Code. It looks like the below image:
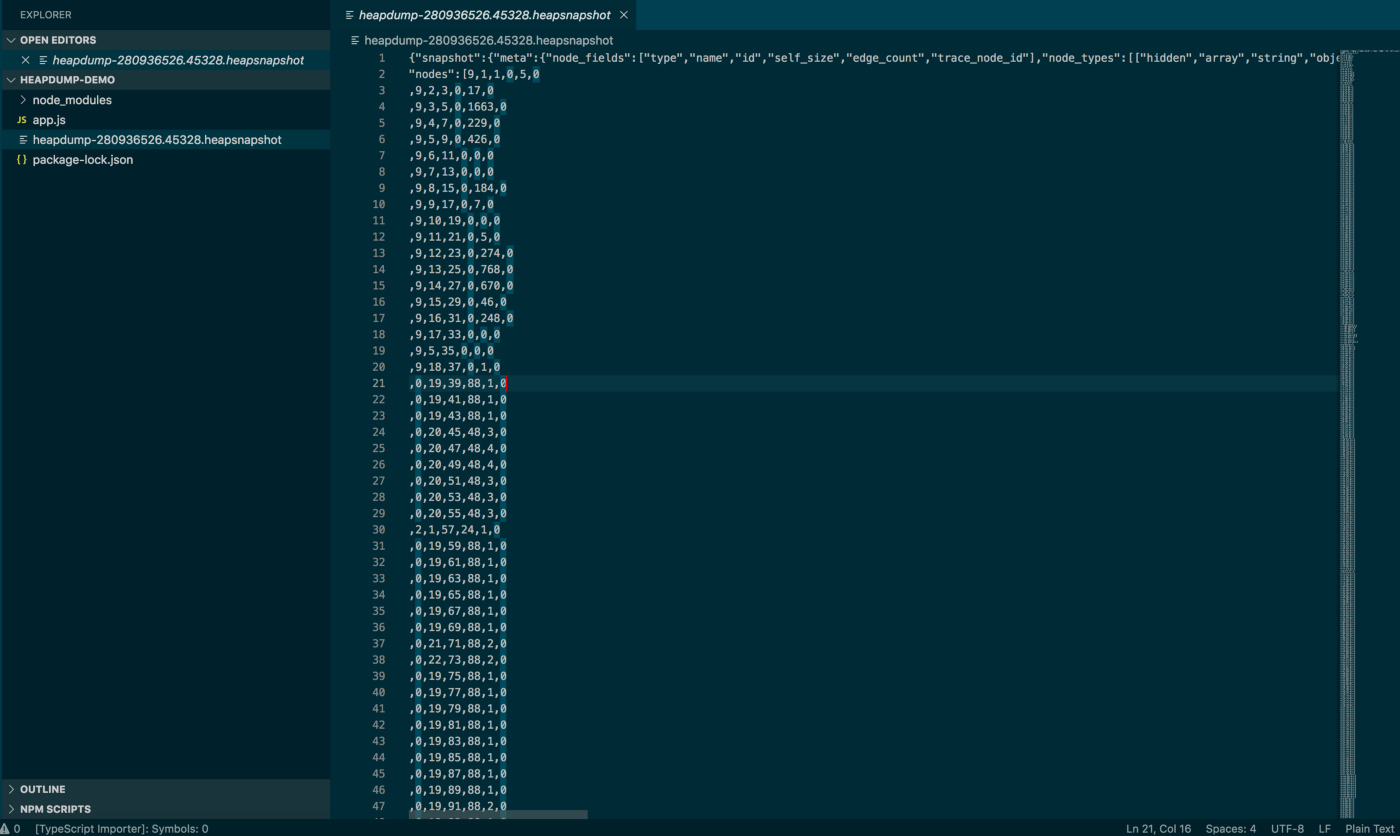
file heapdump-280936526.45328.heapsnapshot
Step 4. Upload Heap Dump to Chrome DevTools:
To upload this heap dump, you need to follow the below instructions.
Open the Chrome browser => open Chrome DevTools => go to memory => click on Load button => load the file
heapdump-280936526.45328.heapsnapshot from its specific location.
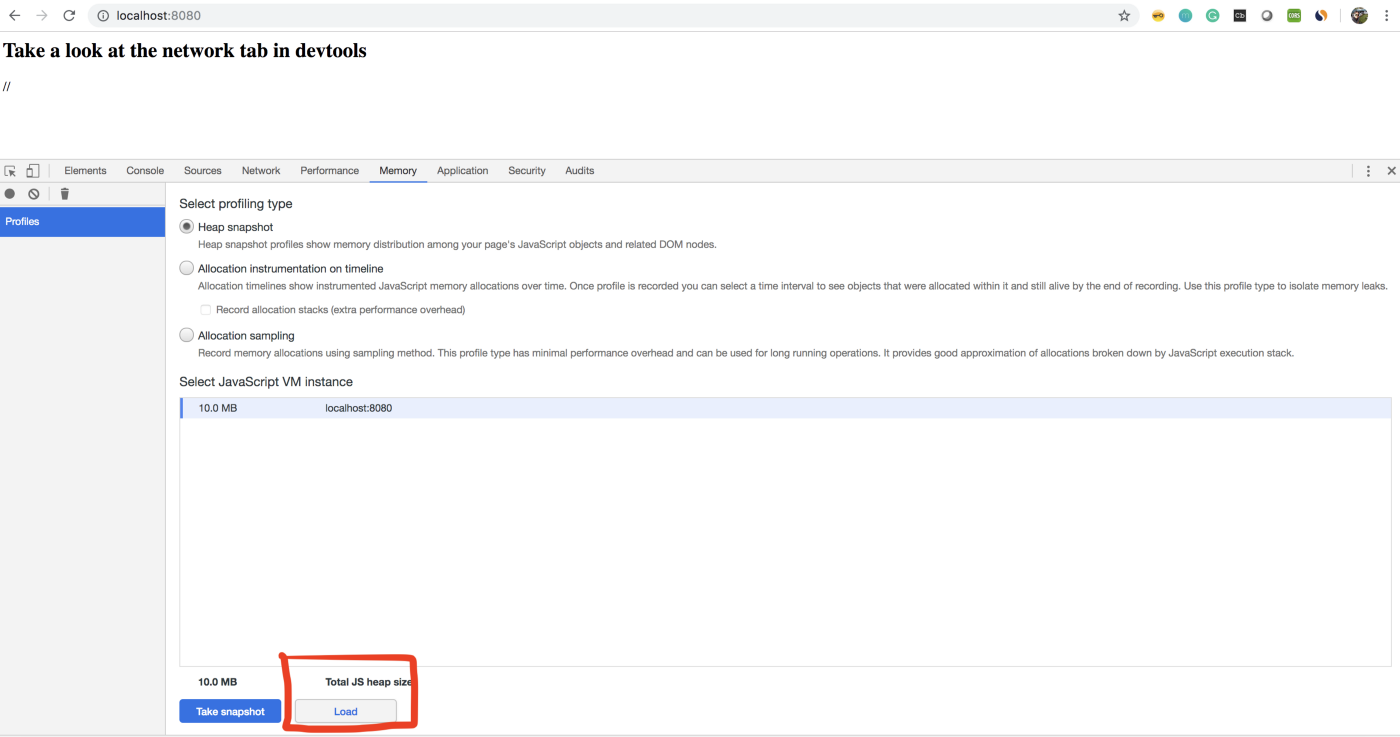
Chrome DevTools
After successfully loading, you can see this file in the left-hand side of the Chrome tool under Profile and HEAP SNAPSHOTS, as below:
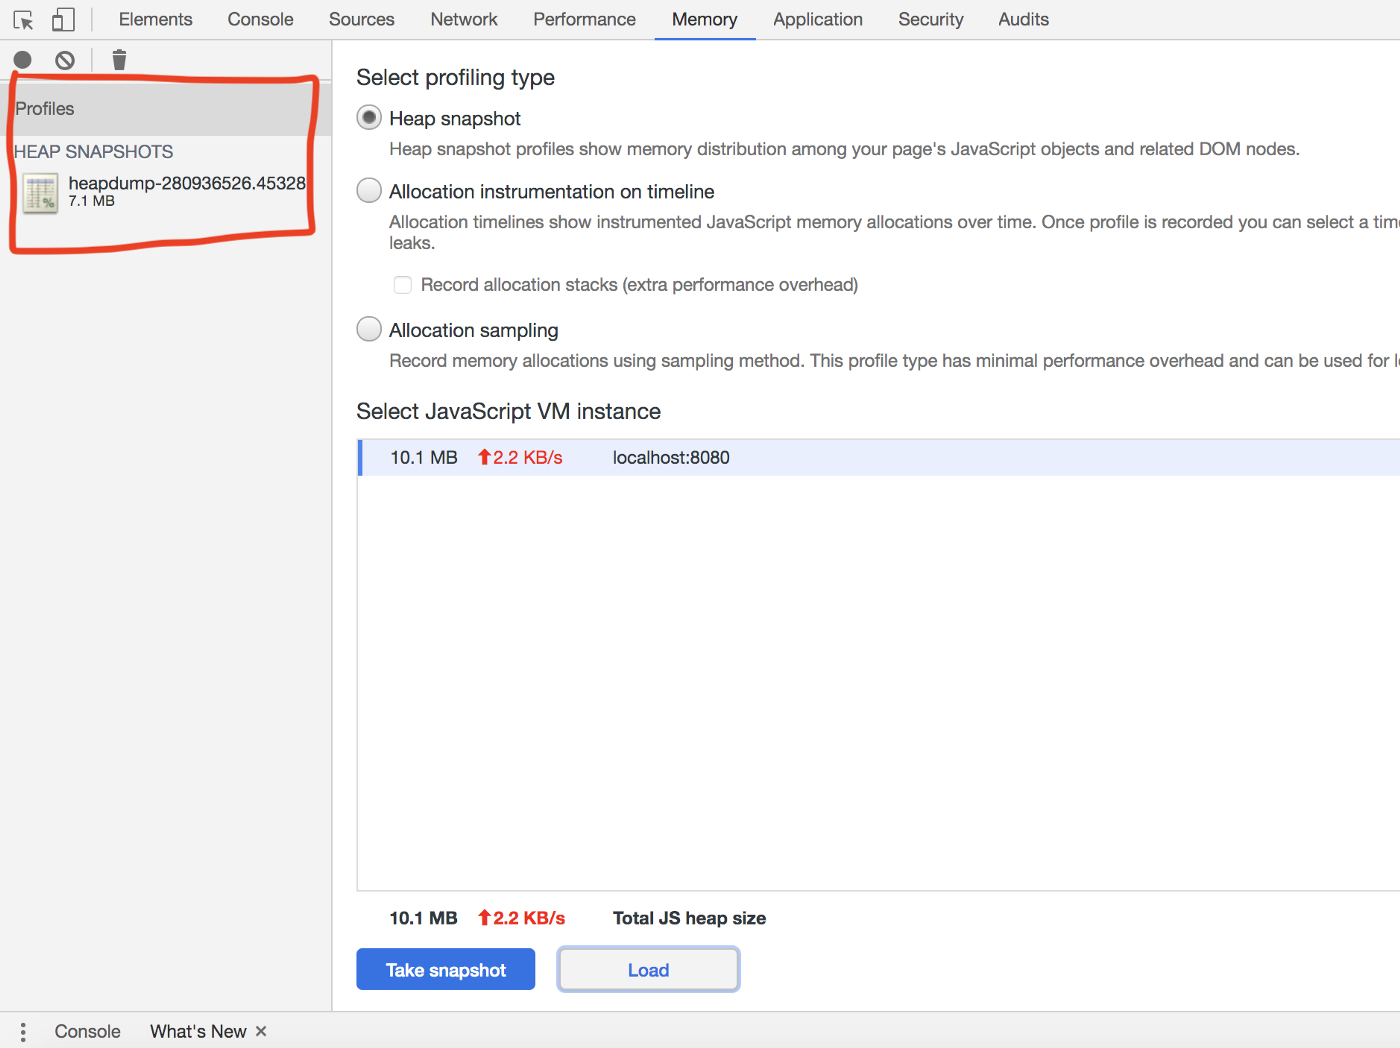
Showing uploaded snapshots
Step 5: Inspect Data
Click on the uploaded file heapdump-280936526.45328.heapsnapshot and inspect the data.
You can see a summary here:

Summary
You can see the containment:

Containment
You can see the statistics:
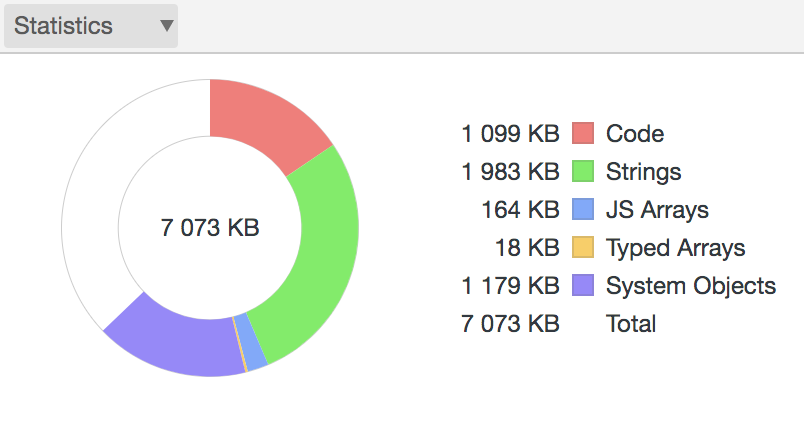
Statistics
Conclusion
In this article, we learned about the v8 dump and also learned how you can create your heap dump based on conditions using the below code and compare the data:
heapdump.writeSnapshot('/' + Date.now() + '.heapsnapshot');
heapdump.writeSnapshot(function (err, filename) {
console.log('dump written to', filename);
});
This code is responsible for creating a heap dump. Now you can add this into your project, create a heap dump, and inspect it.
Congratulations, you are becoming an expert in Node.js
If you want to learn more about memory leaks or Node app profiling, or want to know more about heap dumps and its memory, read the RELATED POSTS below:
Strongly Recommended Books For You:
Reading books opens the door to allow in more lights, If we want to know a man of rare intellect, try to know what books he/she reads.For India:
For Other Countries (United States, United Kingdom, Spain, Italy, Germany, France, Canada, etc)
Thank you
I appreciate you taking the time to read this article. The more that you read, the more things you will know. The more that you learn, the more places you'll go.
If you’re interested in Node.js or JavaScript this link will help you a lot.
If you found this article is helpful, then please share this article's link to your friends to whom this is required, you can share this to your technical social media groups also.
You can follow us on our social media page for more updates and latest article updates.
To read more about the technologies, Please
subscribe us, You'll get the monthly newsletter having all the published
article of the last month.


