C
reating a flame graph of your Node.js app is pretty simple and easy to learn. Flame graph is basically used
to explore and visualize the app's performance. In this article, We'll learn the following
things:
* What is a flame graph?
* How do we use a flame graph in our Node.js app?
* How do we create a flame graph in our Node.js app?
Let’s learn about flame graphs.
Flame Graph and It's Uses:
Flame graph is a set of Node's stacks taken from a cycle of event loop. Flame graph is basically used to
gather information to help understand where and what time is spent in our node's appication.
We use "V8 profiler" which is an importat part of javascript's V8 engine, this V8 profiler gather all the
information of event loop like where the event loop spends time, How the heap is being used for the which
process, and what is the cause of event loop blocking, which function is responsible for event loop blocked.
Flame graph is used to identify the bottlenecks of node's process.
A flame graph is a type of visualization of the code paths that need to be identified quickly and should be
accurate. It can be generated by using any profiling tools. There are many types of flame graphs, like CPU,
memory, off-CPU, etc. Here we will learn about the CPU flame graph.
The flame graph is used to analyze the function and CPU stack. You can see what function is taking the time
and how CPU stack is being created for your app. You can optimize your function and speed up your app.

Flame graph example image- How to create a Flame Graph of Your Node.js App?
How to Create a Flame Graph?
In this article, we'll see how we can create the flame graph. To create the flame graph, some important steps are:
* Create a small node app.
* Install the dependencies.
* Install Flamebearer.
* Run command : node --prof app.js
* Generate flame graph.
Step 1: Create a small node app:
To create this small app, create two files in the same directory with name app.js and package.json and write
the code inside the specific file as:
package.json:
                                //package.json
                                {
                                "name": "flame-graph-exercise",
                                "version": "1.0.0",
                                "private": true,
                                "scripts": {
                                "start": "node --perf-basic-prof-only-functions app.js"
                                },
                                "author": "Shubham Verma",
                                "dependencies": {
                                "express": "^4.14.1",
                                "fast-levenshtein": "^2.0.6"
                                }
                                }
Now create a server file with name "app.js", this will be our main server ( node app ).
app.js:
In the above code, we have created a simple nodejs server and following 3 ends points:
'/''/api/tick''/api/end'
Now take a look in the codes and try to understand the logics.
Step 2: Go to the project location and run below command:
npm installNow, it's time to install the app's dependencies by using above command.

Snapshot of npm install- How to create a Flame Graph of Your Node.js App?
Again run below command to start the app:
If your node server will run successfully then you can see the below output:

Snapshot of node app.js- How to create a Flame Graph of Your Node.js App?
If you can see the message “go to http://localhost:8080/ to generate traffic” it means your app is running and ready to move on the next step.
Step 3: Install Flamebearer globally by using below command:
In this node app we are going to use a npm module "flamebearer" to generate the flame graph. flamebearer is a
tool to generate flme graph for nodejs and V8. flamebearer generate the lightweight and fast flame graph
and provie the responsive UI, You need not to worry about the screen. It is good for any kind of screen.
To install "flamebearer", run the below command:
Output of command "npm install -g flamebearer":

Snapshot of installing flamebearer- How to create a Flame Graph of Your Node.js App?
or

Snapshot of installing flamebearer 2- How to create a Flame Graph of Your Node.js App?
Step 4: Go to the app location and run below command to profile your app:
Now need to run the following command to profile the node application.

Snapshot of command node — prof app.js- How to create a Flame Graph of Your Node.js App?
Step 5: Open a browser and go to http://localhost:8080/
Now you need to open a browser and hit the given URL to hit some APIs to your server. After opening http://localhost:8080/ you can see there are so many hits to your server:
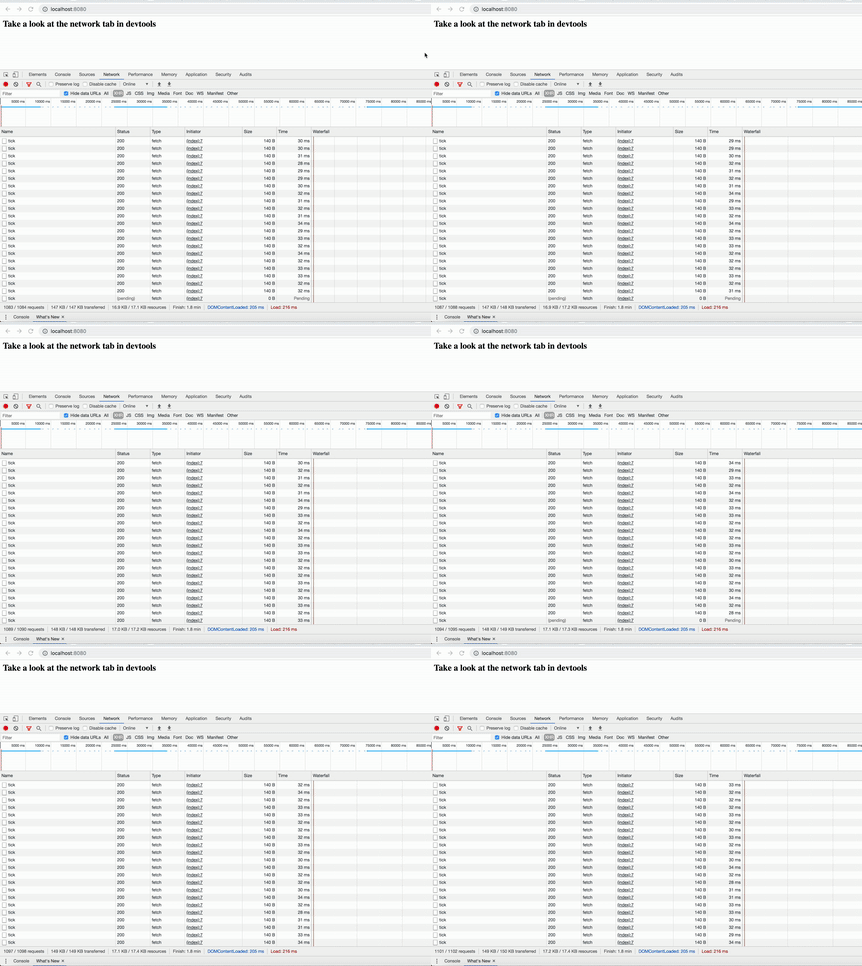
Gif of continuous hits to your server- How to create a Flame Graph of Your Node.js App?
Step 6: Check your log file in your app directory
After running the command node — prof app.js, you can see that there is a log file with a name like isolate-XXXXXXX.log (here isolate-0x102804400-v8.log) will be created.
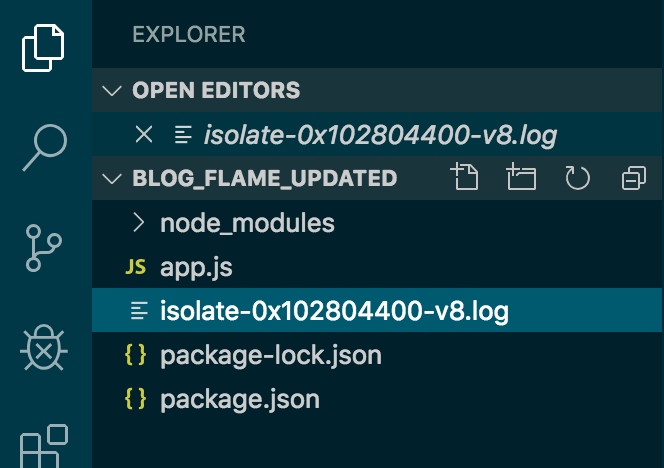
Snapshot of app directory- How to create a Flame Graph of Your Node.js App?
And this isolate-XXXXXXX.log file should have code something like in the below image:
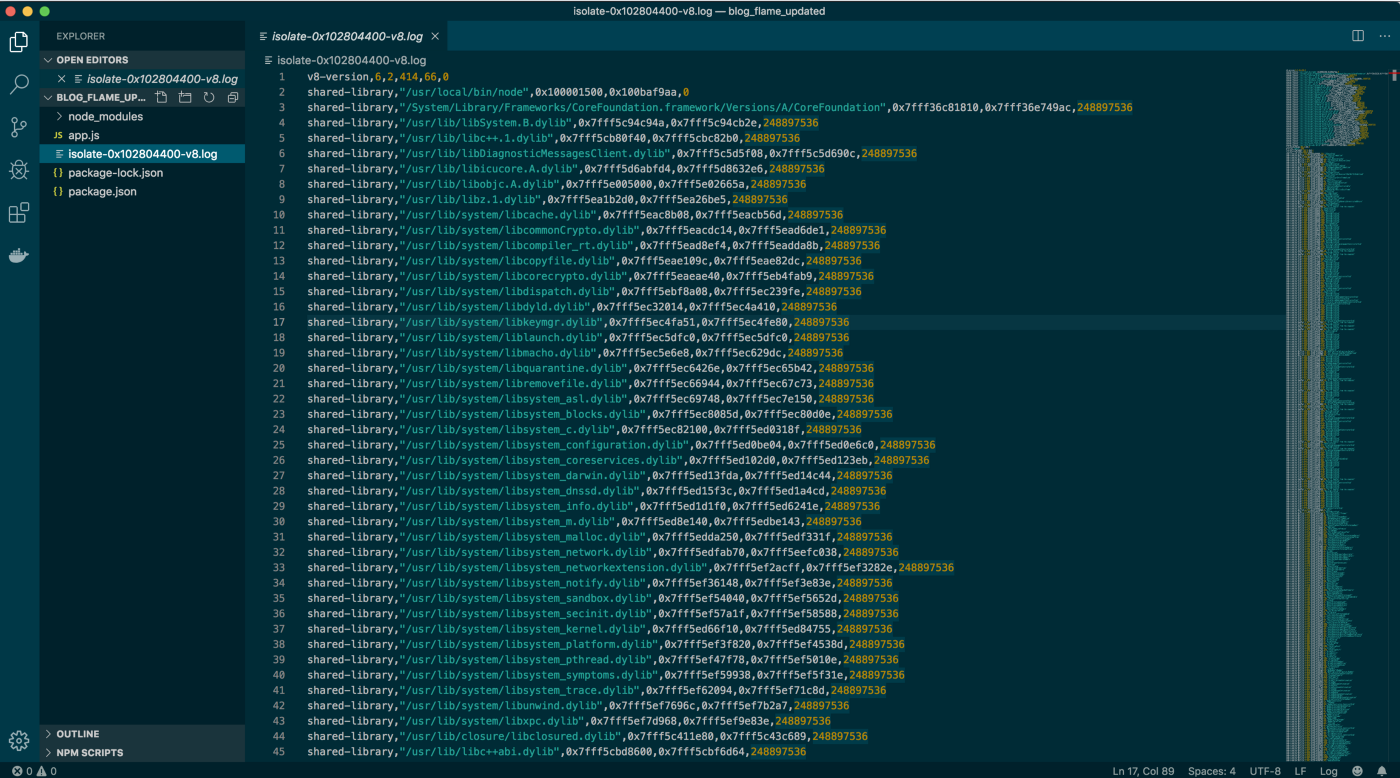
Snapshot of .log file- How to create a Flame Graph of Your Node.js App?
This file creation and its code shows that you are in the right direction.
Step 7: Generate flamegraph.html from a V8 log using below command
Open a new terminal and go to the app location and hit the below command (remember the other terminal where you run the command node — prof app.js will still be running).
node --prof-process --preprocess -j isolate*.log | flamebearer
Snapshot of step 6- How to create a Flame Graph of Your Node.js App?
After running the command node- -prof-process — preprocess -j isolate*.log | flamebearer, it should generate the HTML file with the name flamegraph.html. You can see this file in your project directory as:
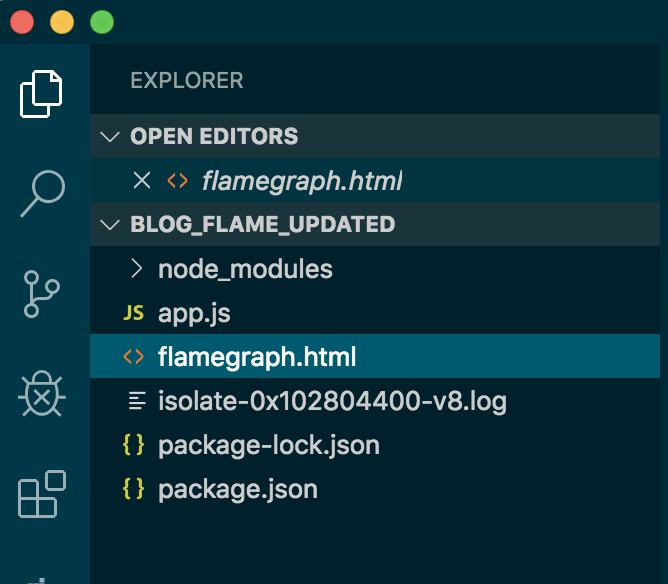
Snapshot of flamegraph.html file in the directory- How to create a Flame Graph of Your Node.js App?
And this flamegraph.html should contain HTML code something like in below image:
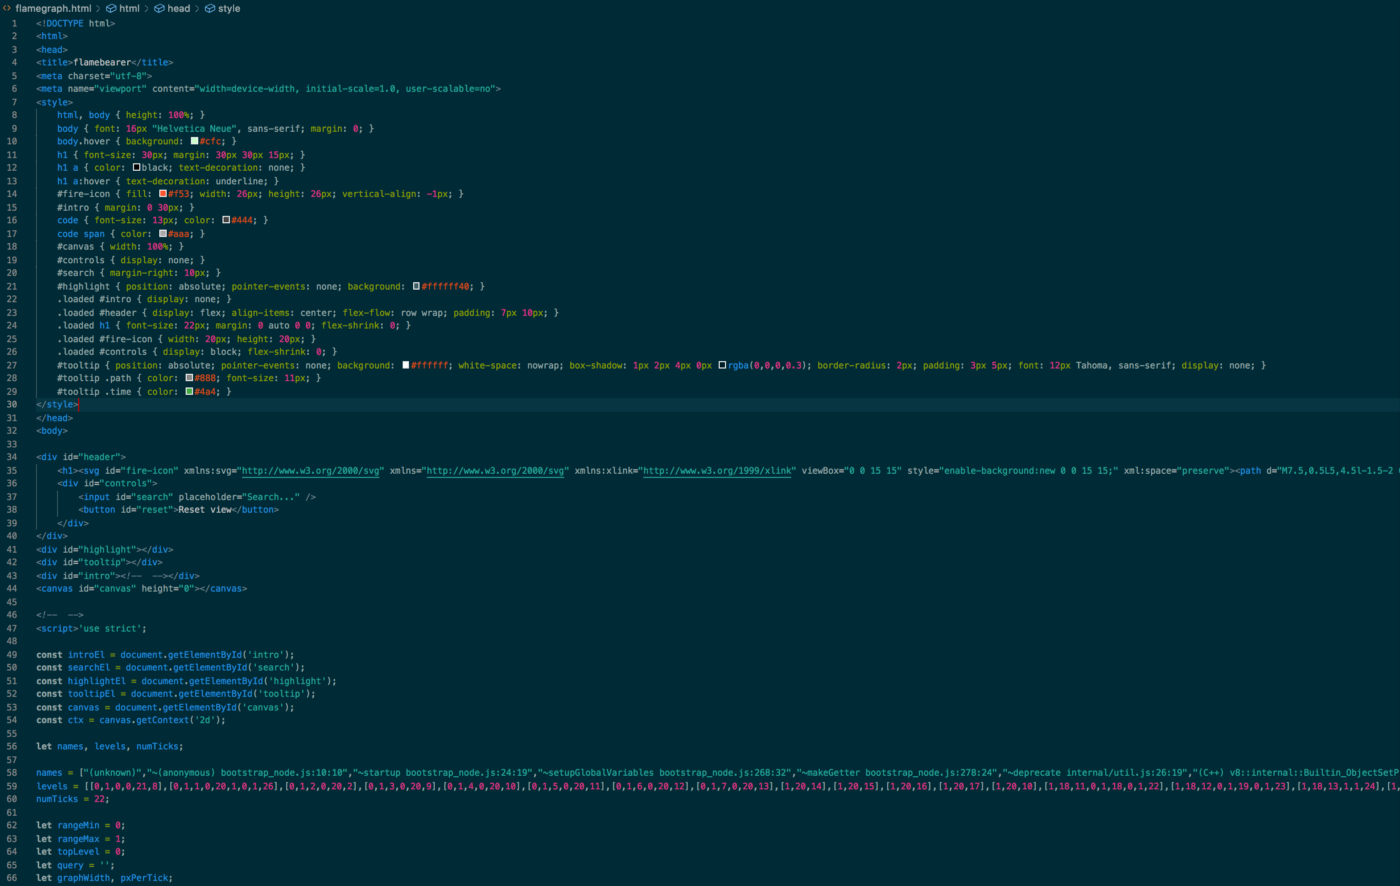
Snapshot of flamegraph.html code- How to create a Flame Graph of Your Node.js App?
Open it manually if it's not opened automatically (as you run the above command the file flamegraph.html will be created and will be open in any browser).
Step 8: Wow! your flame graph is created
Now our flame graph is created and its time to analyze:
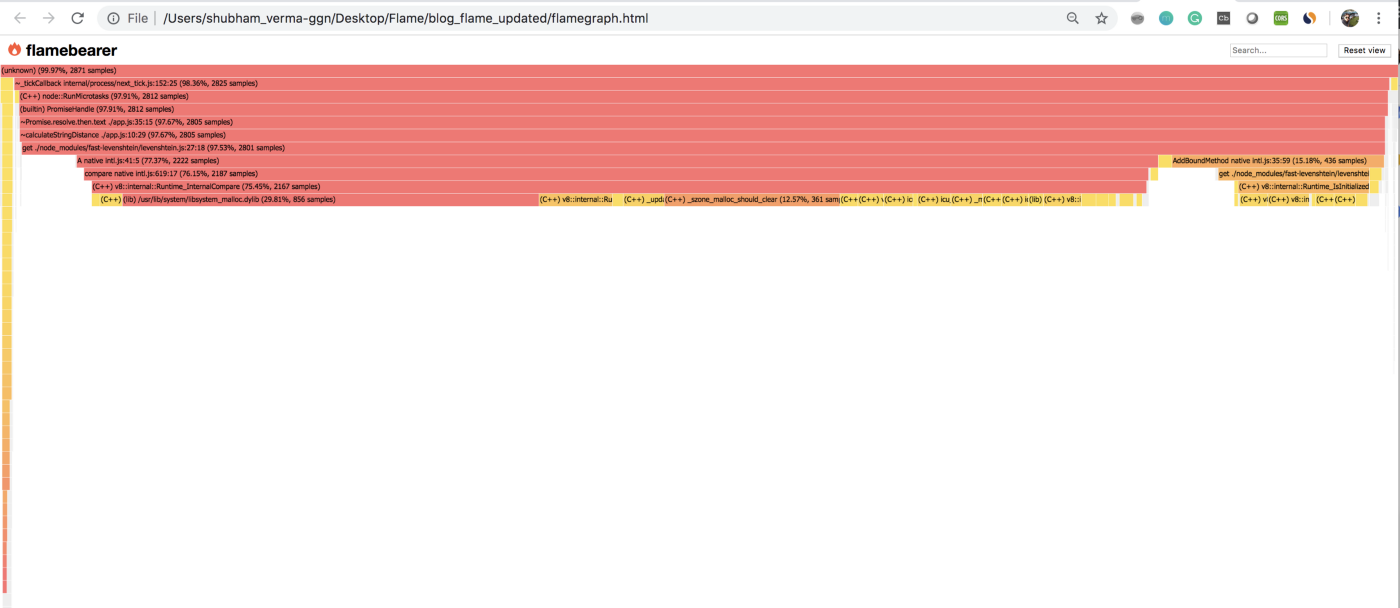
Snapshot of Flame graph of this app- How to create a Flame Graph of Your Node.js App?
You can see our function calculateStringDistance is showing its profile with the file name based on the
number of sampling.
Let’s observe this graph carefully:
* Each box in the above image represents a function in the stack (a stack frame).* The y-axis (horizontal box) denotes stack depth (number of frames on the stack). The top box shows the function that was on-CPU.
* The x-axis (vertical) spans the sample population.
* The width of each box shows the total time it was on-CPU or part of ancestry that was on-CPU (based on sample count). It means functions with wide boxes may consume more CPU per execution than those with narrow boxes or may simply be called more often.
* This visualization was called a flame graph, as it was first used to show what is hot on-CPU and it looked like flames.
Click on a specific box to know the details:
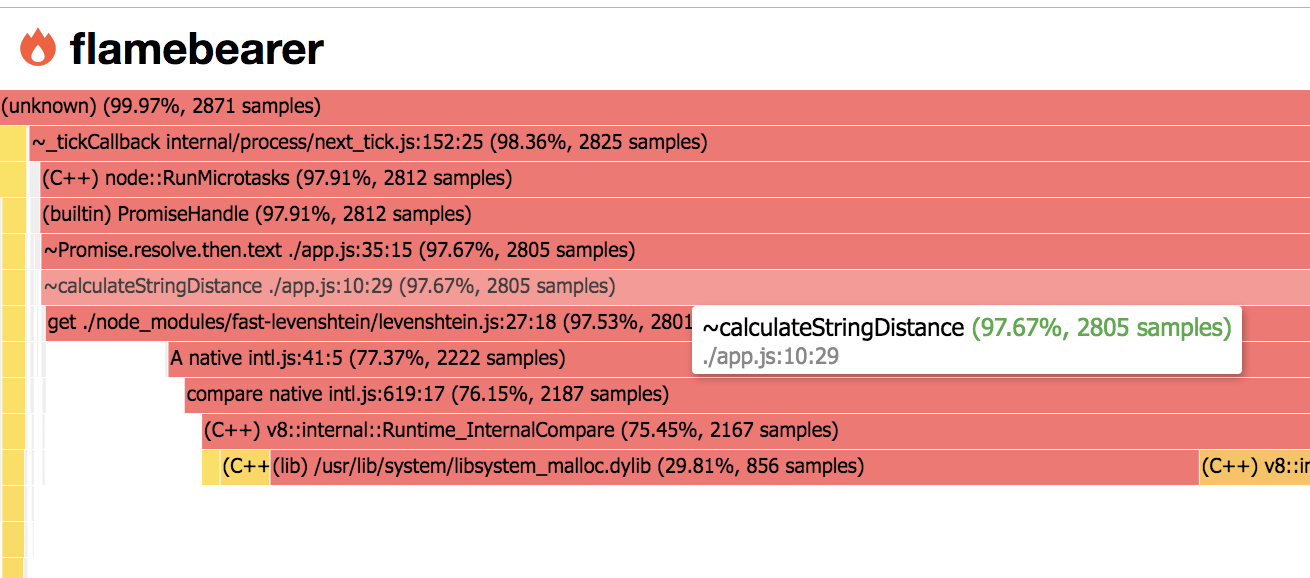
Showing calculateStringDistance function- How to create a Flame Graph of Your Node.js App?
After clicking:

Clicked view of a function- How to create a Flame Graph of Your Node.js App?
Search the function and click on it:
In this flame graph, you can search (in the upper right corner) a function and click to see the details chart of this particular function as:
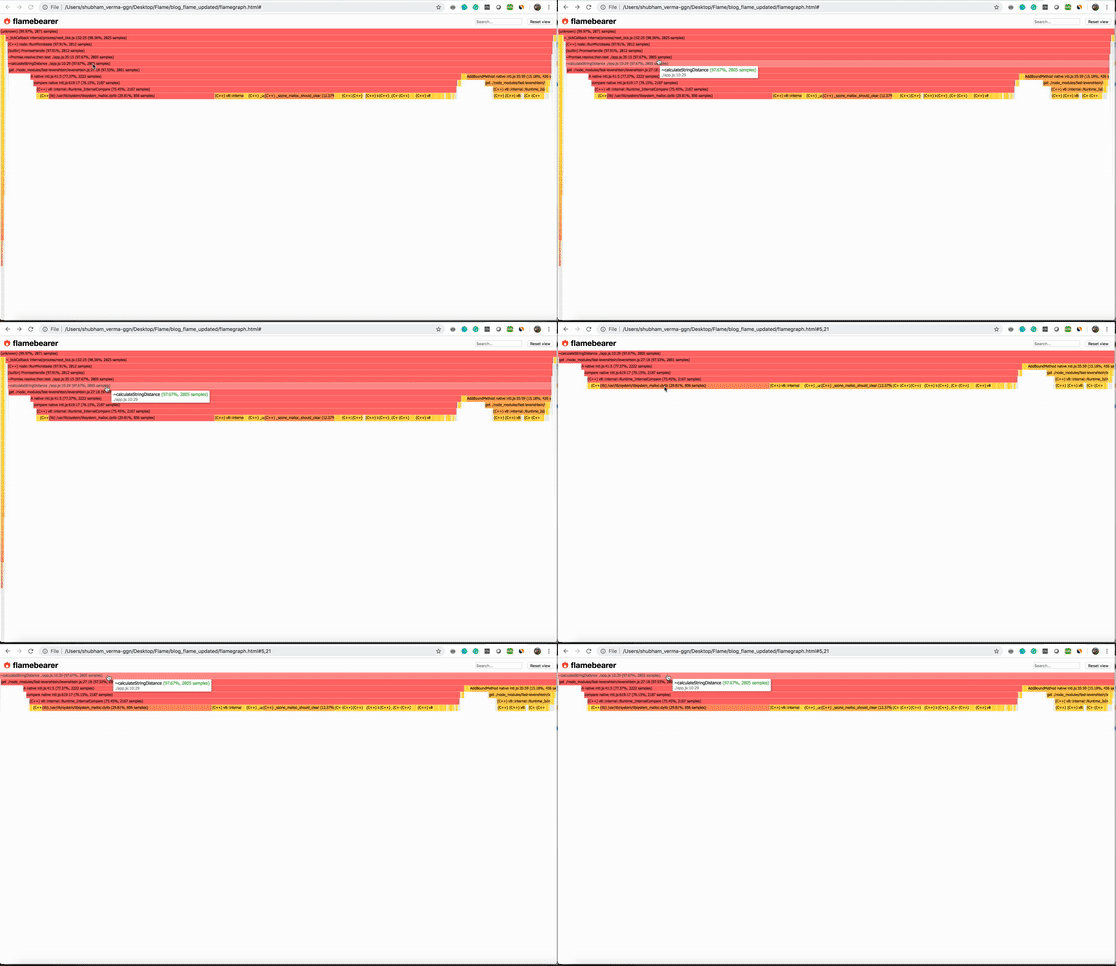
Flame graph views- How to create a Flame Graph of Your Node.js App?
Now using this flame graph, you can see where CPU time is statistically spent on your app/code/function, and you can optimize the code.Conslusion:
In this article, we learned following things:
* What is a flame graph?
* How do we use a flame graph in our Node.js app?
* How do we create a flame graph in our Node.js app?
Congratulations! Now you can create flame graph of your node app.
Strongly Recommended Books For You:
Reading books opens the door to allow in more lights, If we want to know a man of rare intellect, try to know what books he/she reads.For India:
For Other Countries (United States, United Kingdom, Spain, Italy, Germany, France, Canada, etc)
Thank you
I appreciate you taking the time to read this article. The more that you read, the more things you will know. The more that you learn, the more places you'll go.
If you’re interested in Node.js or JavaScript this link will help you a lot.
If you found this article is helpful, then please share this article's link to your friends to whom this is required, you can share this to your technical social media groups also.
You can follow us on our social media page for more updates and latest article updates.
To read more about the technologies, Please
subscribe us, You'll get the monthly newsletter having all the published
article of the last month.


